The AZ-400 objectives ask for metrics for planning, development, testing, security, delivery and operations, and for dashboards that show flow measures such as cycle time, lead time and time to recovery. The DevOps Research and Assessment (DORA) metrics are the standard measure of software delivery performance. Figure 2.1 places these measures on the delivery timeline.
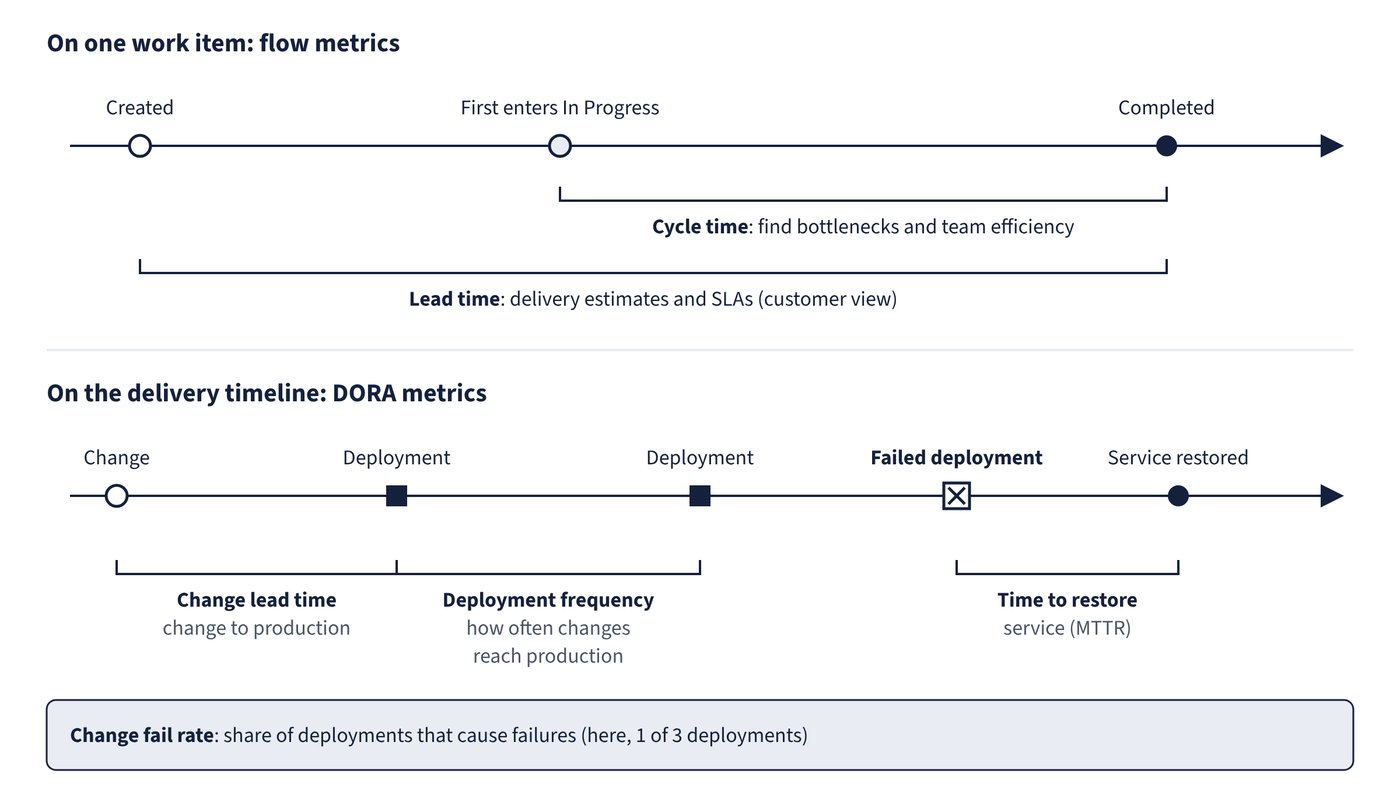
The DORA metrics
| DORA metric | What it shows | Where the data comes from |
|---|---|---|
| Deployment frequency | How often changes reach production | Pipeline run and deployment data in Analytics |
| Change lead time | Time from change to production | Work item lead time, pull request and pipeline timing |
| Change fail rate | Share of deployments that cause failures | Failed stages and runs (Pipeline pass rate report), linked bugs |
| Time to restore service (MTTR) | How quickly service recovers after a failure | Incident and monitoring data (Azure Monitor, Application Insights) |
Operations metrics alongside DORA include mean time between failures (MTBF), time to acknowledge, availability, latency and throughput. Microsoft’s platform engineering guidance recommends measuring a baseline first and focusing on the metrics that drive agreed goals, because collecting metrics costs effort.
Metrics by area
| Area | Example metrics | Azure DevOps source | GitHub source |
|---|---|---|---|
| Planning | Velocity, burndown and burnup, sprint capacity, lead time | Velocity, Burndown, Sprint Capacity, Lead Time widgets; Analytics views | Projects current and historical charts (burn-up) |
| Development | Active pull requests, code change activity, cycle time | Pull Request widget, Code Tile, Cycle Time widget, Analytics version-control data | Pull requests and Projects views |
| Testing | Test pass rate, failing tests, flaky tests, duration | Test Results Trend widgets, Test failures report, Test Analytics | Status checks from workflow runs |
| Security | Open, new, dismissed and fixed alerts by severity; scanning coverage | Advanced Security Security overview (Risk, Coverage and Alerts tabs) | GitHub Advanced Security alerts |
| Delivery | Pipeline pass rate, duration, deployment status, deployment frequency | Pipeline pass rate and duration reports, Deployment status and Release Pipeline Overview widgets | Actions workflow run history |
| Operations | Availability, MTTR, MTBF, failures | Azure Monitor and Application Insights (see the chapter “Monitoring and instrumentation for DevOps”) | Same Azure Monitor data |
Pipeline and test reports
Pipeline analytics reports open from a pipeline’s Analytics tab:
- Pipeline pass rate: pass rate, a daily failure trend split by stage, and the top failing tasks with links to failed runs.
- Pipeline duration: the duration trend and the tasks that contribute most to duration.
- Test failures: the pass rate, the distinct count of failing tests and the top failing tests, groupable by test file and other pivots.
All three default to the last 14 days and can be filtered by date range and branch. Test Analytics is available only with Azure Pipelines.
For security, the Advanced Security Security overview (Organization settings > Security overview) has a Risk tab (alert distribution and severity for repositories with Advanced Security enabled, counting only alerts on each default branch and defaulting to the past seven days), a Coverage tab (enablement status across all repositories) and an Alerts tab (combined alerts with filters and CSV export of up to 1,000 alerts). Organisation-level roll-up metrics on the Risk tab are in private preview. Scanning tools themselves are covered in the chapter “Security and compliance scanning”.
Common trap: Measuring change fail rate from test pass rate alone - change fail rate concerns deployments that cause failures in production; pipeline pass rate, failed stages and linked production bugs are the relevant signals.